Accuracy
For sure, you want to have a perfect system which is never wrong. Two populations exist in a biometric system:
- The good guys (genuine users), allowed to enter in the protected area.
- The bad guys (impostors), that should not enter, but they will try.
Unfortunately, no system is perfect. More information in the absolute security myth.
Enrollment / FTE (failure to enroll)
First of all, genuine users must be enrolled. At this level, problems happen: some users may not be enroll for some reasons (see the biometrics for all myth) So a first rate is defined, the FTE failure to enroll rate, which is the percentage of genuine users that cannot be enroll. A good system should have a 100% FTE rate.

Several politics may apply, and some of them can have some drastic results.
For instance, we may decide to reject the genuine users that cannot be enroll. In this case, the further performances of the systems will be very good, as the difficult guys are not accepted in the system.
At the contrary, the system may accept everyone, including difficult to enroll guys. In this case, the threshold must be lowered, and so impostors will have better chances to be accepted...
Real system
In a real system, a good guy arrive: this is the presentation stage. He also shows a badge which is giving his name. A live acquisition is done, for instance we acquire an image of his face, which is compared to the stored image at enrollment of the given name. The biometric system will compute a similarity score. Two cases happen:
- The similarity score is higher than a preset score: the good guy enters. This is what we would like at every try, a 100% success.
- The similarity score is lower than the reset score, which is not good. Note that we have no security problem at this point: the good guy cannot enter, he is not happy with that, but this is the only consequence.
The following figure will give you an idea that the system may be wrong in the case of
face recognition, after a while, because of aging.

In the case of the presentation of an impostor, for instance someone having stolen the badge of a genuine user, two cases happens:
- The similarity score is lower than the preset threshold, and the bad guy is rejected. This is what we want.
- The similarity score is higher than the preset threshold: the bad guy enters, which is clearly a security problem!
Errors accounting: FAR, FRR
To characterize a system, we have to know two rates:
- What is the percentage of genuine user tentatives to enter that have been accepted/rejected?
- What is the percentage of impostors tentatives to enter that have been rejected/accepted?
There are several ways to announce these rates:
- We may give the percentage of accepted good guys and rejected impostors. So these rates must be as close as 100%. They are called True Accept Rate and False Reject Rate. They are not practical to use, because it is difficult to handle numbers such as 99.96%.
- In general, it is easier to use the FRR, False Reject Rate, which is the percentage of genuine user rejected tentatives, and FAR, False Accept Rate, which is the percentage of impostor accepted tentatives. These numbers should be as close to zero as possible.
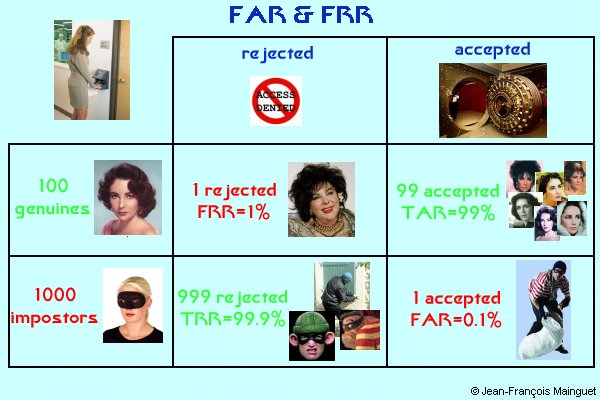
Usual FRR numbers (the rejected good guys) are in the few percent range. Remember that we are speaking of tentatives, so a 1% reject rate means that in most cases, the good guy will enter at the second try.
Usual FAR numbers depends a lot on the system. For police application where we seek for a guy inside a large database (millions of records), we need FAR such as 1 for 1 million, that is 10-6. For a simple application such as a logon in a phone, FAR are in the range of 1 for 10000, which is 0.01% or 10-4.
FAR & FRR are linked
Never forget that the False Reject Rate and the False Accept Rate are linked.
A "high security" system, with a high threshold, will let enter an impostor with very much difficulties (so a low FAR), but will also let enter genuine users with difficulties as well (so a high FRR). At the contrary, a permissive system with a low threshold will practically never reject a genuine user, but also the impostors!
This can be explained with the score distributions of genuine users and impostors. Let's start with genuine users. Good guys should always have pretty good scores, for instance close to 100 if the similarity score is between 0 and 100. But from time to time, some scores are pretty low. At the moment, this is not a big deal, and the score distribution of genuine users looks like that:

We can do the same with impostors. The score distribution of impostors should be close to zero, but also, from time to time, some impostors may have some pretty high scores:

The shape of distribution score can be very various, this is not the point here. But the problem is the recovery of the two distributions. We would like to have two separated distributions, and so the threshold would be very easy to decide, but in the real world, it never happens.
So the manager of the biometric has to choose a threshold. But where to place it?
- If he chooses a low threshold, then all good guys will enter, but also a high percentage of bad guys! This a security problem.
- If he chooses a high threshold, then bad guys will not enter. But he will face a lot of genuine users that will come to complain that the system is not working...
The distribution scores will enable to compute the FAR and FRR for a given threshold. It is now obvious that these two rates are linked.
From time to time, you will find some bad marketing guys announcing some excellent FAR and FRR scores : it is likely that they are not using the same threshold for each numbers, and so it means absolutely nothing. You can get also a look at the accuracy myth.
ROC & DET curves
For each threshold value, you have a FAR and a FRR. Varying the threshold value will give what is called a ROC or DET curve.
- Detection Error Trade-off (DET) curve :
a DET curve plots error rates on both axes, giving uniform treatment to both types of error. The graph can then be plotted using logarithmic axes. DET curves can be used to plot matching error rates (False Nonmatch Rate against False Match Rate) as well as decision error rates (False Rejection Rate against False Accept Rate). - Receiver Operating Characteristics (ROC) curve
shows the performance of pattern matching algorithms over a range of decision criteria. Such curves plot the "false accept probability" (i.e., false acceptance rate) on the x-axis, and "correct detection probability" (i.e., 1- false rejection rate) on the y-axis.


Difficult to read these curves? Don't worry, I always get some headache each time I try to understand that. Why the hell are they using logarithmic on the FRR scale as it never happens to have low numbers? Why displaying numbers that are unuseful on the FAR side? Numbers close to 1 (= everyone is accepted) are never used...
EER Equal Error Rate
Ah! The infamous Equal Error Rate! This is the particular point where FAR=FRR, that is the crossing point of the diagonal (if the two scales are identical, sure).
This number is sometimes used to compare results and systems. Unfortunately, a real system never use a threshold corresponding to the EER, it would be badly adjusted. In the real world, you are using numbers such as a few % for the FRR, and very low numbers for the FAR. As a result, take care when you are using EERs.
Myself, I like to use the FRR value with a fixed FAR number, for instance 10-4 or 10-5. So you immediatly get usable numbers that characterize the system.
Patience
Okay, I am an impostor, and I know that the system FAR is adjusted to be 10-3, so 1 to 1000. So I just need to try 1000 times to get a chance to enter the system ? For instance, with a fingerprint system, with a try every 2 or 3 seconds, after one hour, I will enter?
If you believe this, then you did not understand how a biometric system works. You can compare this with a code. Trying 1000 times the same finger is trying 1000 times the same code, it will give you (almost) 1000 times the same result. You need to try 1000 different random fingers to get a chance to enter the system...
How to get confused...
Or, more positively, what are the requested information so that I can trust the FAR and FRR numbers.
Imagine you are facing a fingerprint system. The first time you try, the system rejects your finger. So you try a second time. Again rejected. The third tentative is the good one, you are accepted. How do you count this test? Is is two rejections + one good accept ? Or do you count all this as one presentation which is successful? After all, you are a genuine user, and you enter the system.
Depending how numbers are manipulated, you can get very variable results, as you can understand now. And be sure that companies will show "good numbers" to sell their system.
Another problem is how to believe numbers as low as 10-6 ? It means one false acceptation over one million tries. Does that mean that the vendor has effectively tried his system with at least one million persons? No, for sure, you just cannot believe that, that's too much people to hire for testing...
As a result, each time some FAR and FRR numbers are given, demands how they have been computed. What are the statistics behind ? What is the size of the database that has been used? How many persons are inside the test database ? And then, makes your mind.
FTA (failure to acquire)
A last rate that is important: the FTA Failure To Acquire rate. This is when the system missed to acquire a biometric sample. For instance, using a face recognition system, the camera may face a complicated scene because of the background, and the system was not able to detect your face.
It is difficult to count as you don't know who is right. As no matching tentative has been done it is difficult to say that the recognition algorithm did not work. So taking into account these failure in the FAR/FRR rate is not so obvious. Moreover, as the system didn't see anything, only an external observer can say that a failure happens !
As a result, ask about how these kind of errors are taken into account. Then make your mind.